PecuniaThe Pecunia indicator
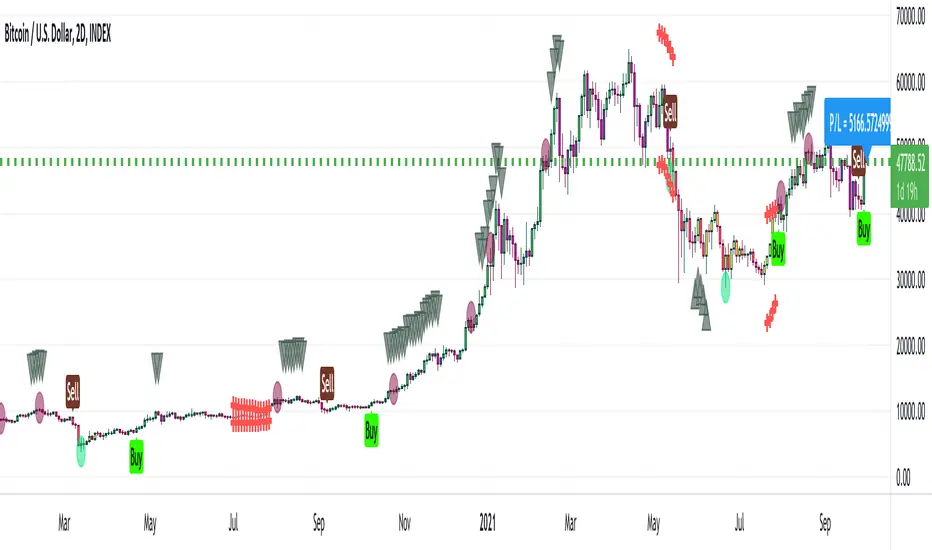
It is a momentum indicator developed by tradewithpecunia. Our indicator is made with more than 4+ robust indicators. The indicator makes use of double top/ double bottom, price action movement, rectangle breakouts & divergence concepts with the crossover of 3+ moving averages.
Different parameters (mathematical calculations for each) have been set by us for each mentioned concept above. The indicator detects different trends in the price using 2 different algorithms. The use of 4 slopes has been done which catches momentum at different positions, according to the parameter set. We call this a knockout system because only when all the parameters are satisfied the buy and sell signal is generated. Even if one parameter fails the signals are not generated, this ensures that there is a momentum check and enough buy and sell signals are produced.
Using 4 parameters for upper bound/lower bounds the catch for median points has been done. 10+ & 10- lengths are looked at from the median points where we have put the stop loss.
Value points
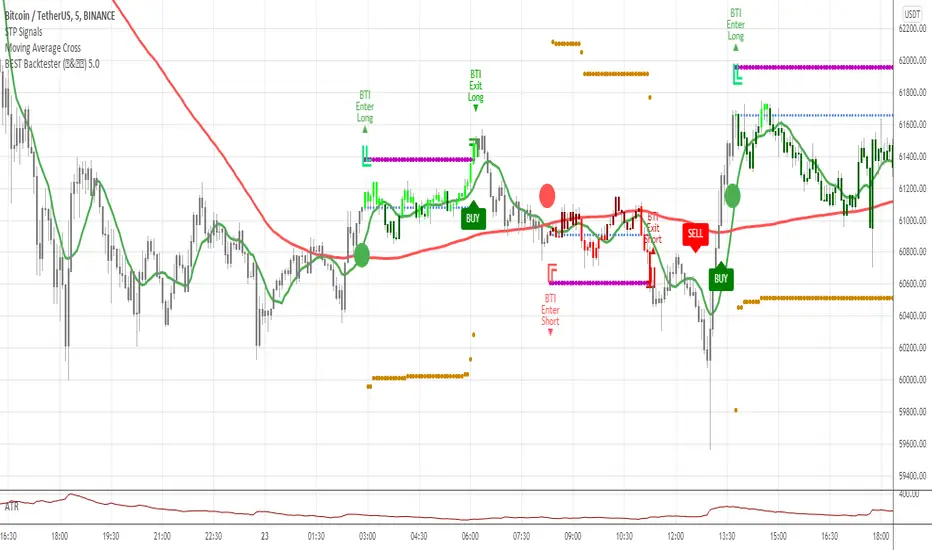
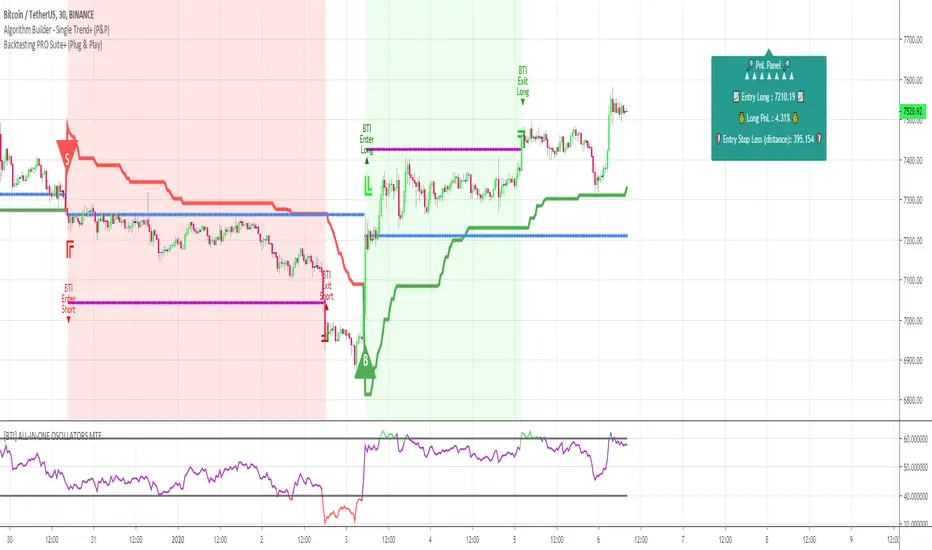
1) The Trade Entry – The indicator continuously looks for suitable data values which when match with the parameters set by us, results in the generation of buy and sell signals. Once the condition is met, the buy and sell signals are displayed on the charts in real-time. Further one can set up an alert that is displayed on the screen and can be modified as an automated alert utilizing the trading view platform’s alert function.
2) The Order Execution – It is recommended to execute the order just before the candle is ended to avoid any hassle or the user can execute the order at the following candle to avoid any false signals set off due to volatility. The choice of instrument to use is the trader’s discretion keeping in mind their own risk/reward involved.
3) Exit Triggers – For an ongoing buy signal, you have to exit or book your profits from the trade at the sell signal. And for an ongoing sell signal, you have to exit or book your profits from the trade at the buy signal. If there is an ongoing buy or sell signal and it’s not moving in our desired trend then you have to take the stop loss at the trade exit signal or its opposite trade signal.
Color Notations:
By default, the color of the buy signal is green and the color of the sell signal is red. The color of the Trade Exit signal is black. Although the user can change the color of the signals at their convenience.
The Features:
1) Easy to understand signal bars
2) Easily distinguishable Buy and Sell signals
3) One must take into consideration that there is no holy grail method
Note:
If you are using this script, you acknowledge that the past performance is not necessarily the indication of future results and there are many more factors that go into being a profitable trader.
Before you proceed:
We are not SEBI Registered Analysts and shall not be culpable for any loss incurred directly or indirectly. Our indicator is no holy grail system. Investment in the stock market is subject to market risk. Trading in stocks, futures, or options is not suitable for every trader and involves a considerable risk of loss.
The market may fluctuate, and the user always has a risk of loss, thus, we won’t be liable for any losses incurred while using our indicator, our trading ideas, or our approach.
Pine Script® göstergesi